
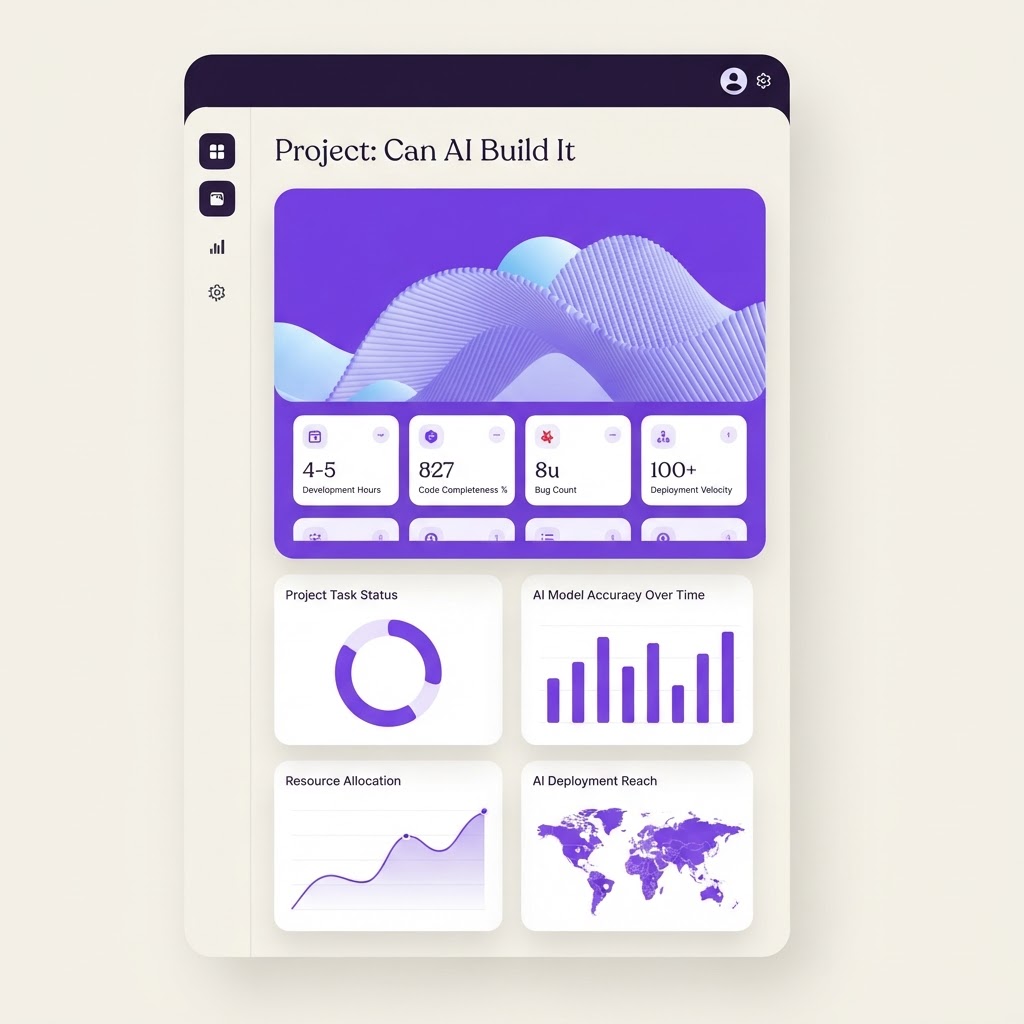
AI Business Analytics Dashboard
A customizable business analytics dashboard that uses AI to surface insights, detect anomalies, and generate natural-language summaries from your company data — no SQL required.
What it does
AI app builders handle this project well. The core components — data visualization, dashboard layouts, and API integrations — are bread and butter for tools like Bolt, Lovable, and v0. The AI insights panel requires an LLM API integration, which is straightforward with a well-structured prompt. The main challenge is the natural language query feature, which needs careful prompt engineering to translate questions into data queries. Overall, an intermediate builder can ship a working version in a weekend. Production readiness depends on data source connectors — start with CSV/Sheets, expand to live databases later.
AI app builders handle this project well. The core components — data visualization, dashboard layouts, and API integrations — are bread and butter for tools like Bolt, Lovable, and v0. The AI insights panel requires an LLM API integration, which is straightforward with a well-structured prompt. The main challenge is the natural language query feature, which needs careful prompt engineering to translate questions into data queries. Overall, an intermediate builder can ship a working version in a weekend. Production readiness depends on data source connectors — start with CSV/Sheets, expand to live databases later.
Build prompt
Build a business analytics dashboard web app with the following features: 1) Connect to common data sources (CSV upload, Google Sheets, REST API endpoints, and a built-in SQLite database for demo data). 2) Display interactive charts (revenue over time, customer growth, conversion funnels) using Recharts or Chart.js. 3) AI-powered insights panel that uses an LLM API to analyze the connected data and surface 3-5 key insights in plain English (e.g., 'Revenue dropped 12% in March, driven by a 30% decline in the Enterprise segment'). 4) Anomaly detection that highlights unusual spikes or drops in any metric with a visual callout. 5) Natural language query bar where users type questions like 'What was our best-selling product last month?' and get a chart + text answer. 6) Customizable widget grid where users can drag and resize charts. 7) Export to PDF and share via link. Use React + TypeScript, Tailwind CSS, Recharts for visualization, and an LLM API (OpenAI or Claude) for insights. Include demo data so it works immediately on first load.
Related builds
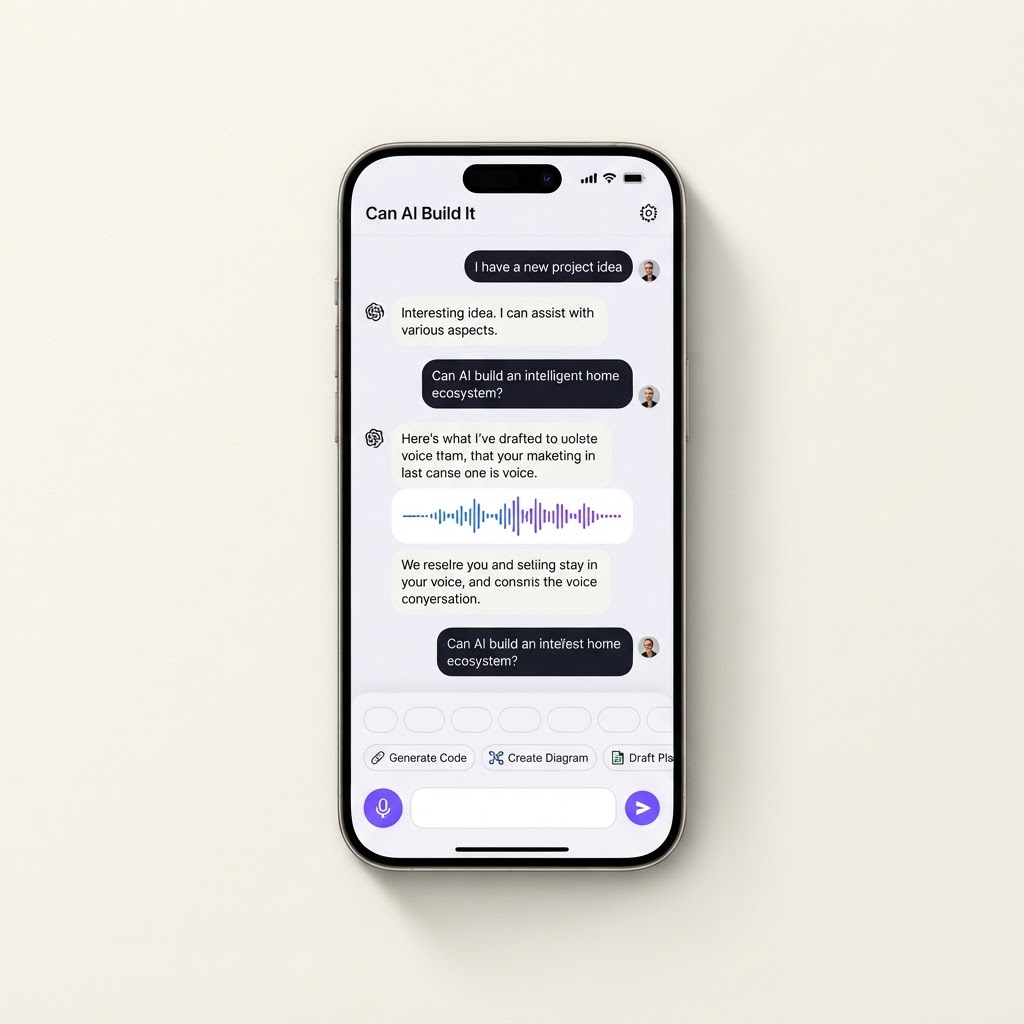
AI Voice Assistant App
A voice-first AI assistant that transcribes speech, generates natural responses, and talks back. Handles customer queries, schedules appointments, and answers knowledge base questions hands-free.
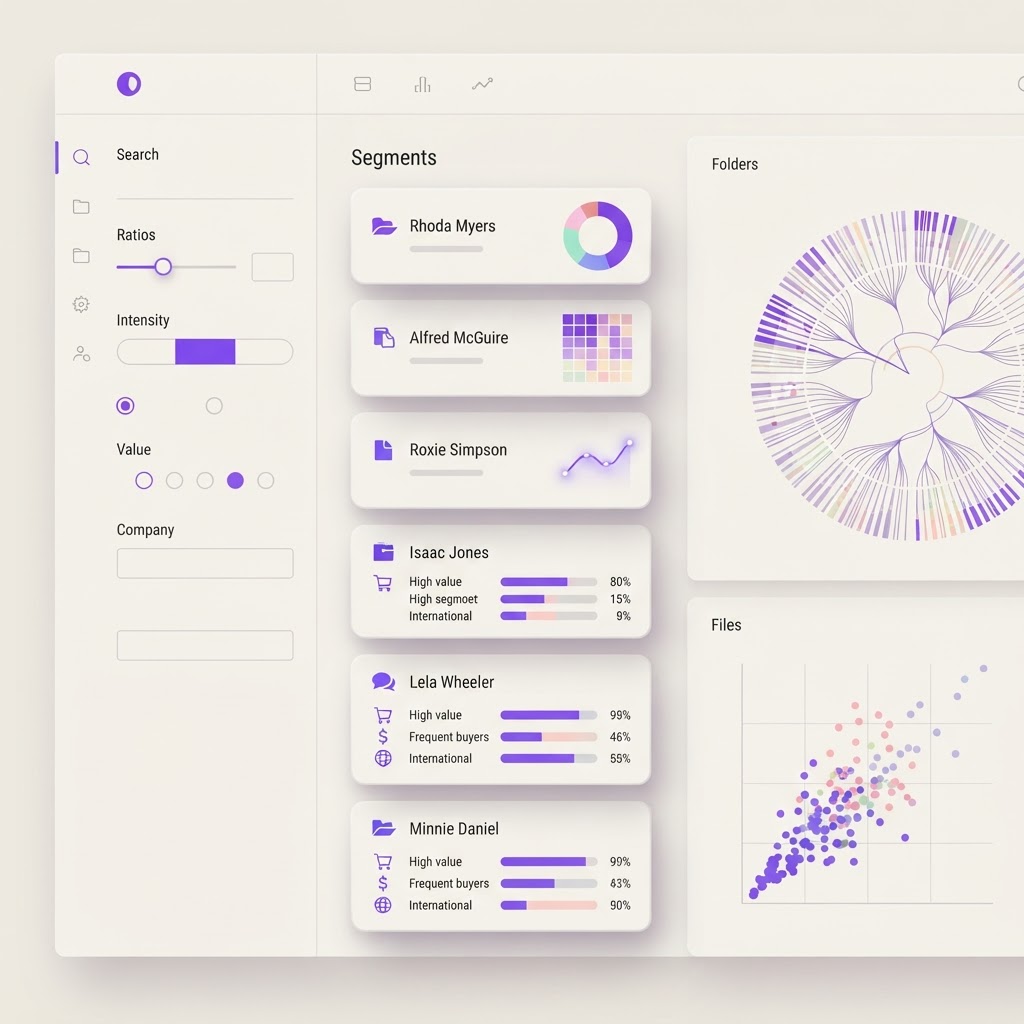
AI Customer Segmentation Tool
Automatically segment your customers based on behavior, purchase history, and engagement patterns. Upload your customer data and get AI-generated segments with actionable insights.
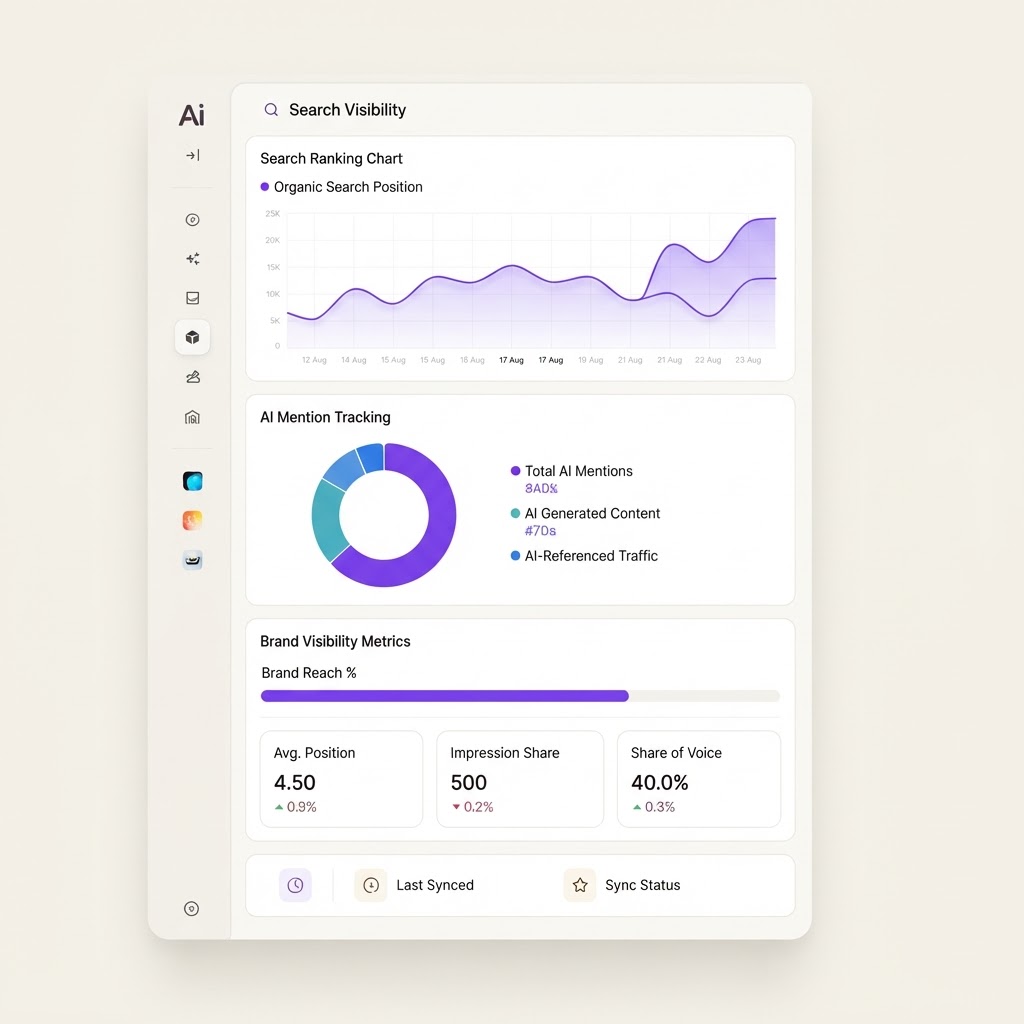
AI Search Visibility Tracker
Track where your brand appears in AI search engines like ChatGPT, Perplexity, and Google AI Mode. Monitor mentions, sentiment, and citation trends over time.